Delphi has a nice feature (since version ??) to check whether you leak some memory in your project. All you have to do is set the ReportMemoryLeaksOnShutDown property to true in your project file.
begin
ReportMemoryLeaksOnShutdown := true;
Application.Initialize;
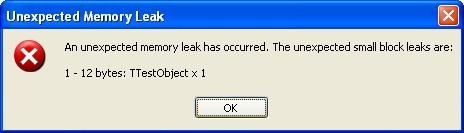
If you forget to free an object you will get an unexpected memory leak exception when you close your application.
This is nice, however we always release allocated memory, don't we?;-)
Although it is nice to know that you leak some memory the messagebox does not help us to find out where it happens. It only reports the type of object, and the spilled memory in bytes.
In the marketplace there are several tools that can be used to signal memory leaks. One in particular, which I am evaluating right now, is Eurekalog.
You can use this tool to catch exceptions and memory leaks in your application. A detailed log file, with call stack, will tell you exactly the location (unit and linenumber) in the source of the unfreed object. Double clicking a line in the call stack opens the unit at that line in the IDE.
Another nice feature of Eurekalog is that you can activate it within your application, so that whenever your user hits an unexpected exception, or memory leak he/she can send the report to you by e-mail or even sent it to your bug tracking system.
The Eurekalog log file for the above memory leak looks like this: 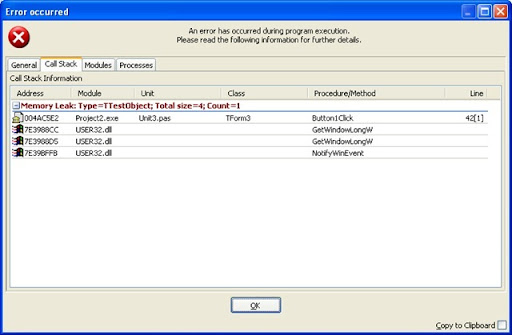
Although we always free memory, use the try...finally construct, you will leak memory sooner or later. Tools like Eurekalog can help you tracking them down easily. Do you know more sophisticated tools, like Eurekalog, to track down memory leaks?
5 comments:
Hi Roland,
> Delphi has a nice feature (since version ??) to check
It depends on FastMM as a new memory manager. So if you install FastMM on delphi 7, you will have this info/option.
Actually, if you use the 'official' FastMM in your project (instead of the custom version that's built right into Delphi itself since version 2005 or so), you can also get all the detailed information you'd like to have: call stack and location of the original memory-allocating code etc. FastMM can also make hunting down access violation bugs a lot easier by displaying/logging additional stack traces in case you free something twice. I'd say, download FastMM from their website (http://fastmm.sf.net) and give it a (free!) go...
Thanks for the Eurekalog-hint.
I use AQTime for profiling memory usage and timing
( http://www.automatedqa.com ), great software, not free, but great.
If you want to track down exceptions, check out madExcept, free and great, but no memory management.
> Delphi has a nice feature (since
> version ??) to check
Introduced with Delphi 2006, but this is actually a FastMM feature.
> Do you know more sophisticated
> tools, like Eurekalog, to track
> down memory leaks?
I have used Memory Sleuth and TurboPower's CodeWatch (part of the Sleuth QA Suite), but for some reason, CodeWatch doesn't seem to work anymore. Could be related to my Delphi version (currently 2007) or the OS (currently XP) - I dunno.
If someone is using CodeWatch with Delphi 2007 on XP, please let me know (yes, I'm running the 3.07 update). StopWatch (the Sleuth QA Suite profiler) seems to work just fine..
also, for Delphi 7 there is free (but more simple) tool for exception trcking, sometime ago it comes with torry.net:
http://www.torry.net/vcl/vcltools/exceptions/StackTracer10.zip
with homepage
http://sourceforge.net/projects/lk-stack-trace/
it much powerless comparing with Eurekalog, but in many cases there are no needs in so hard tools.
Post a Comment